From Reporting Tool to Decision-Making Platform
Kasasa Insight was a business intelligence platform that few clients actively used. Bankers exported data into spreadsheets, support teams fielded questions the platform should have answered, and leadership struggled to understand why adoption remained so low.
I led the research, strategy, and experience redesign effort that transformed Insight into one of the company’s most-engaged products, increasing utilization from less than 2% to 79% while establishing the foundation for Kasasa’s first design system.

A tool built by developers
without client input.
When I joined the Info & Insight team, Kasasa Insight had been available in production for years. The platform was designed to help banks and credit unions understand account growth, deposits, marketing performance, and product adoption.
Yet utilization remained below 2%.
Clients routinely exported reports into Excel rather than using the product directly. Support requests continued to rise, and Client Success teams spent valuable time helping customers interpret information the platform was already providing. The business challenge extended beyond usability. If clients couldn’t connect the data to business outcomes, they couldn’t fully see the value of the products they had invested in.
Research & Discovery
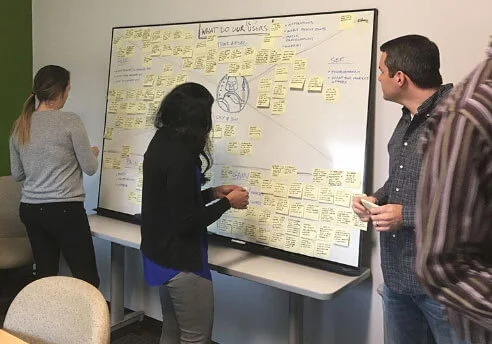
We went to the banks.
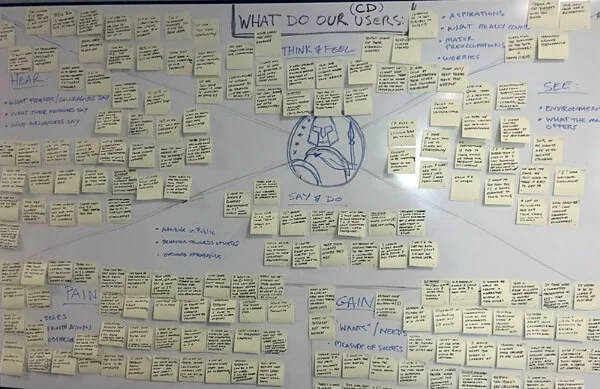
Before redesigning anything, I led a discovery effort that included client site visits, interviews, support audits, usability testing, competitive analysis, and satisfaction benchmarking. Across institutions of different sizes, a consistent theme emerged. Clients trusted the data itself. What they struggled with was translating that data into decisions. Many struggled to locate the numbers they needed, and they weren’t always confident they were focusing on the right metrics, interpreting trends correctly, or understanding what actions to take next.
That insight reshaped the project. The challenge wasn’t creating more reports as much as it was helping people make sense of the information already available to them in their own terms. I realized we had to do it from the ground up.
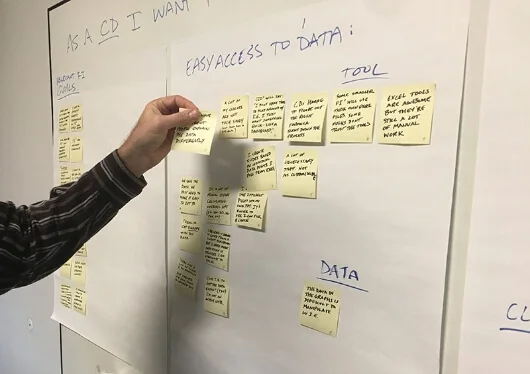
Clients trusted the data enough to export it, but relied on spreadsheets to answer the questions that mattered most.
Re-platforming Strategy
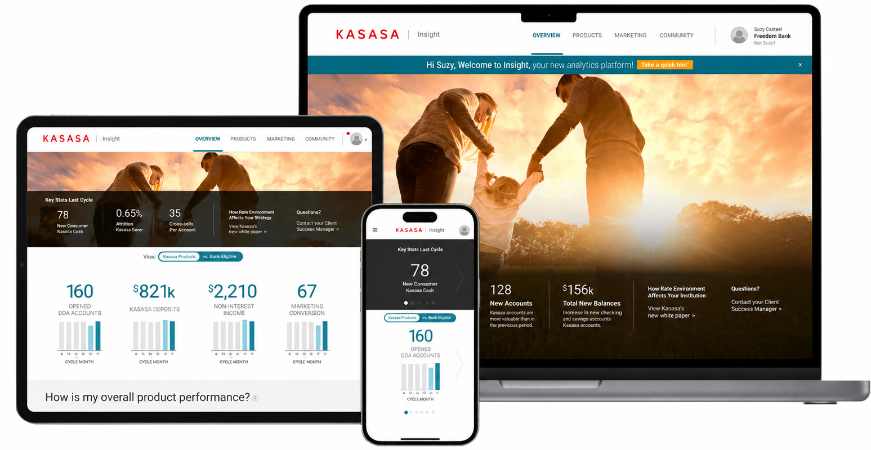
Make it easier to understand what matters.
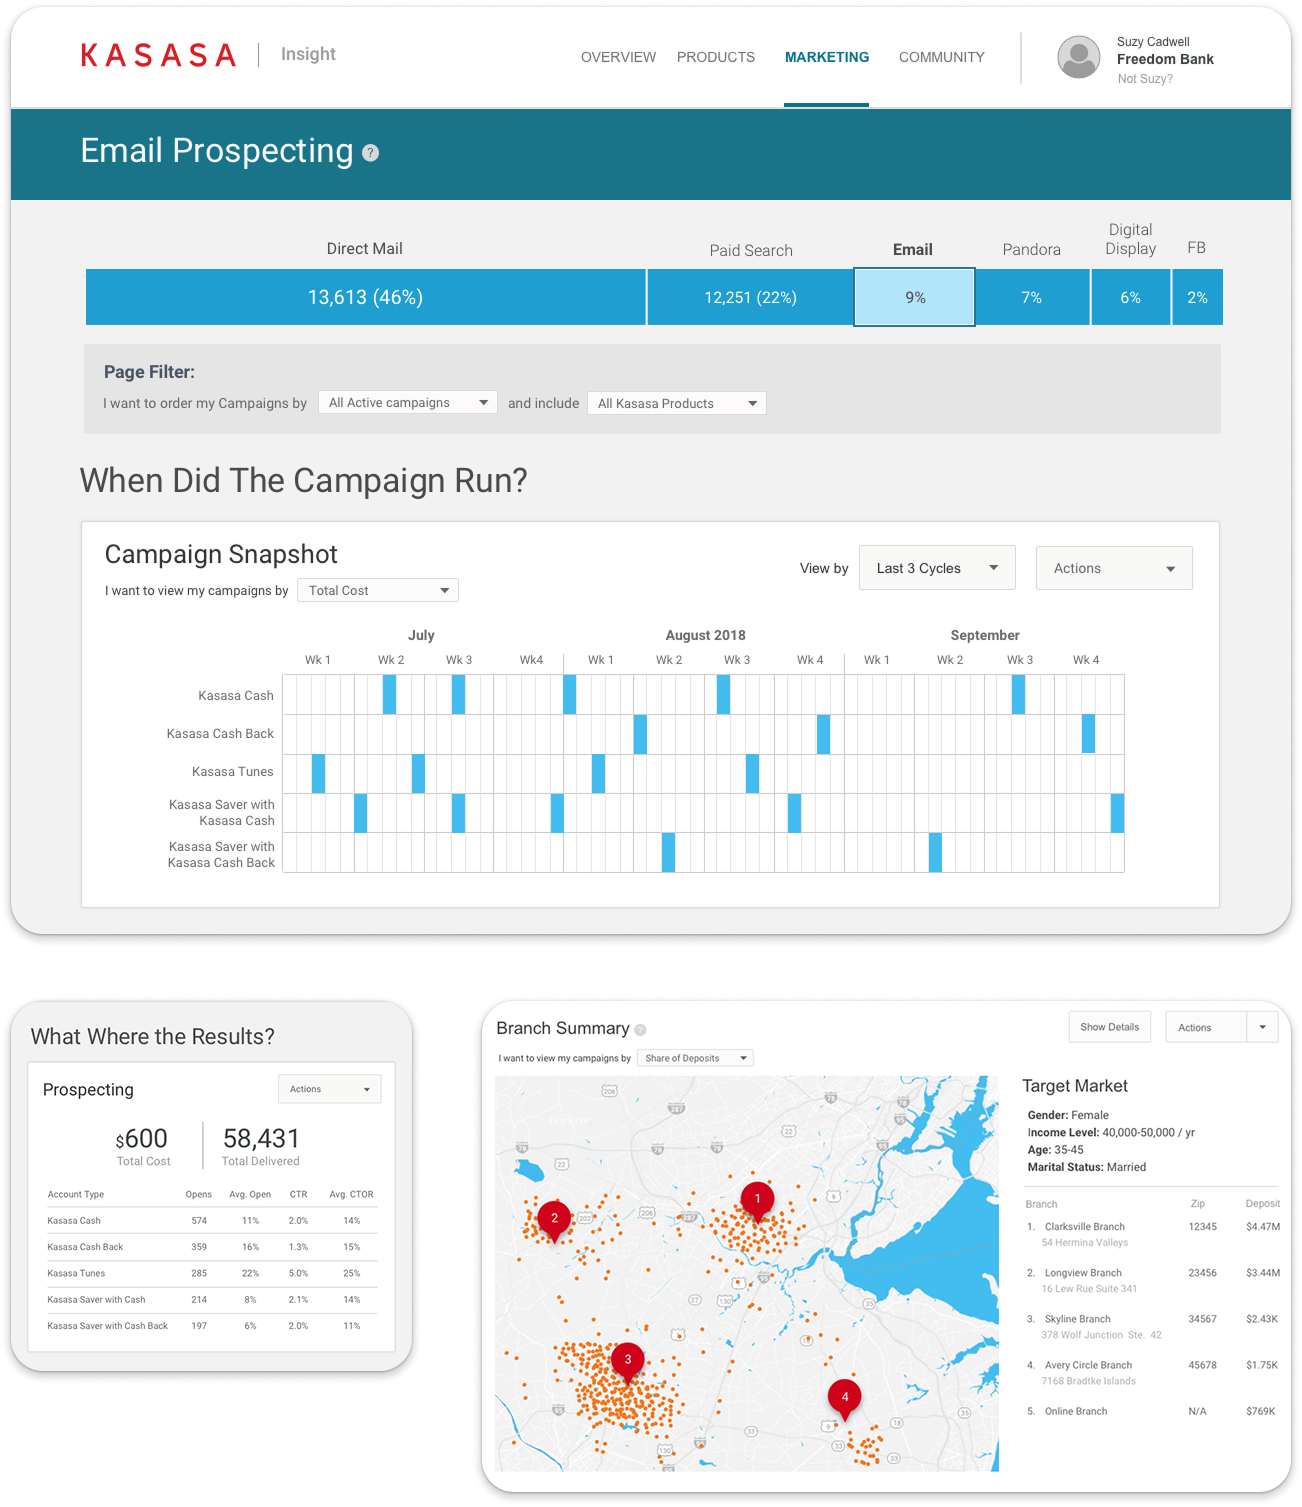
The redesign focused on helping clients answer important business questions faster and with greater confidence, efficiently and up front.
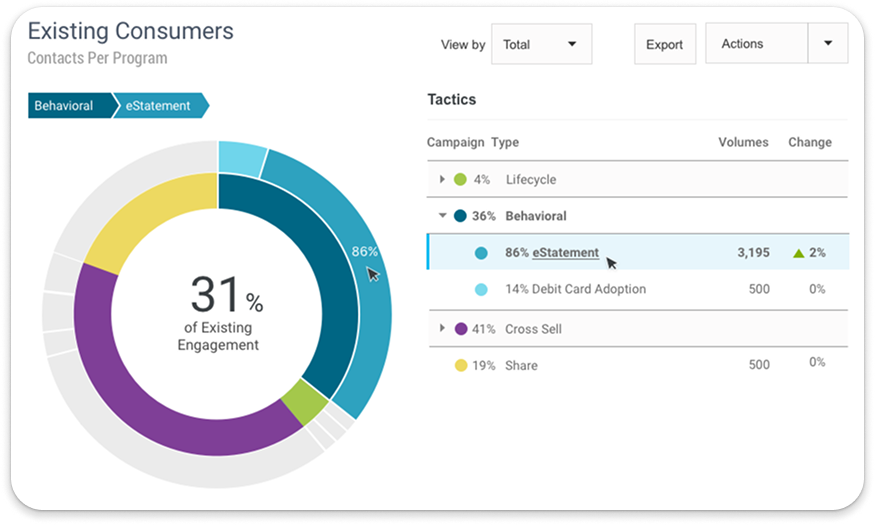
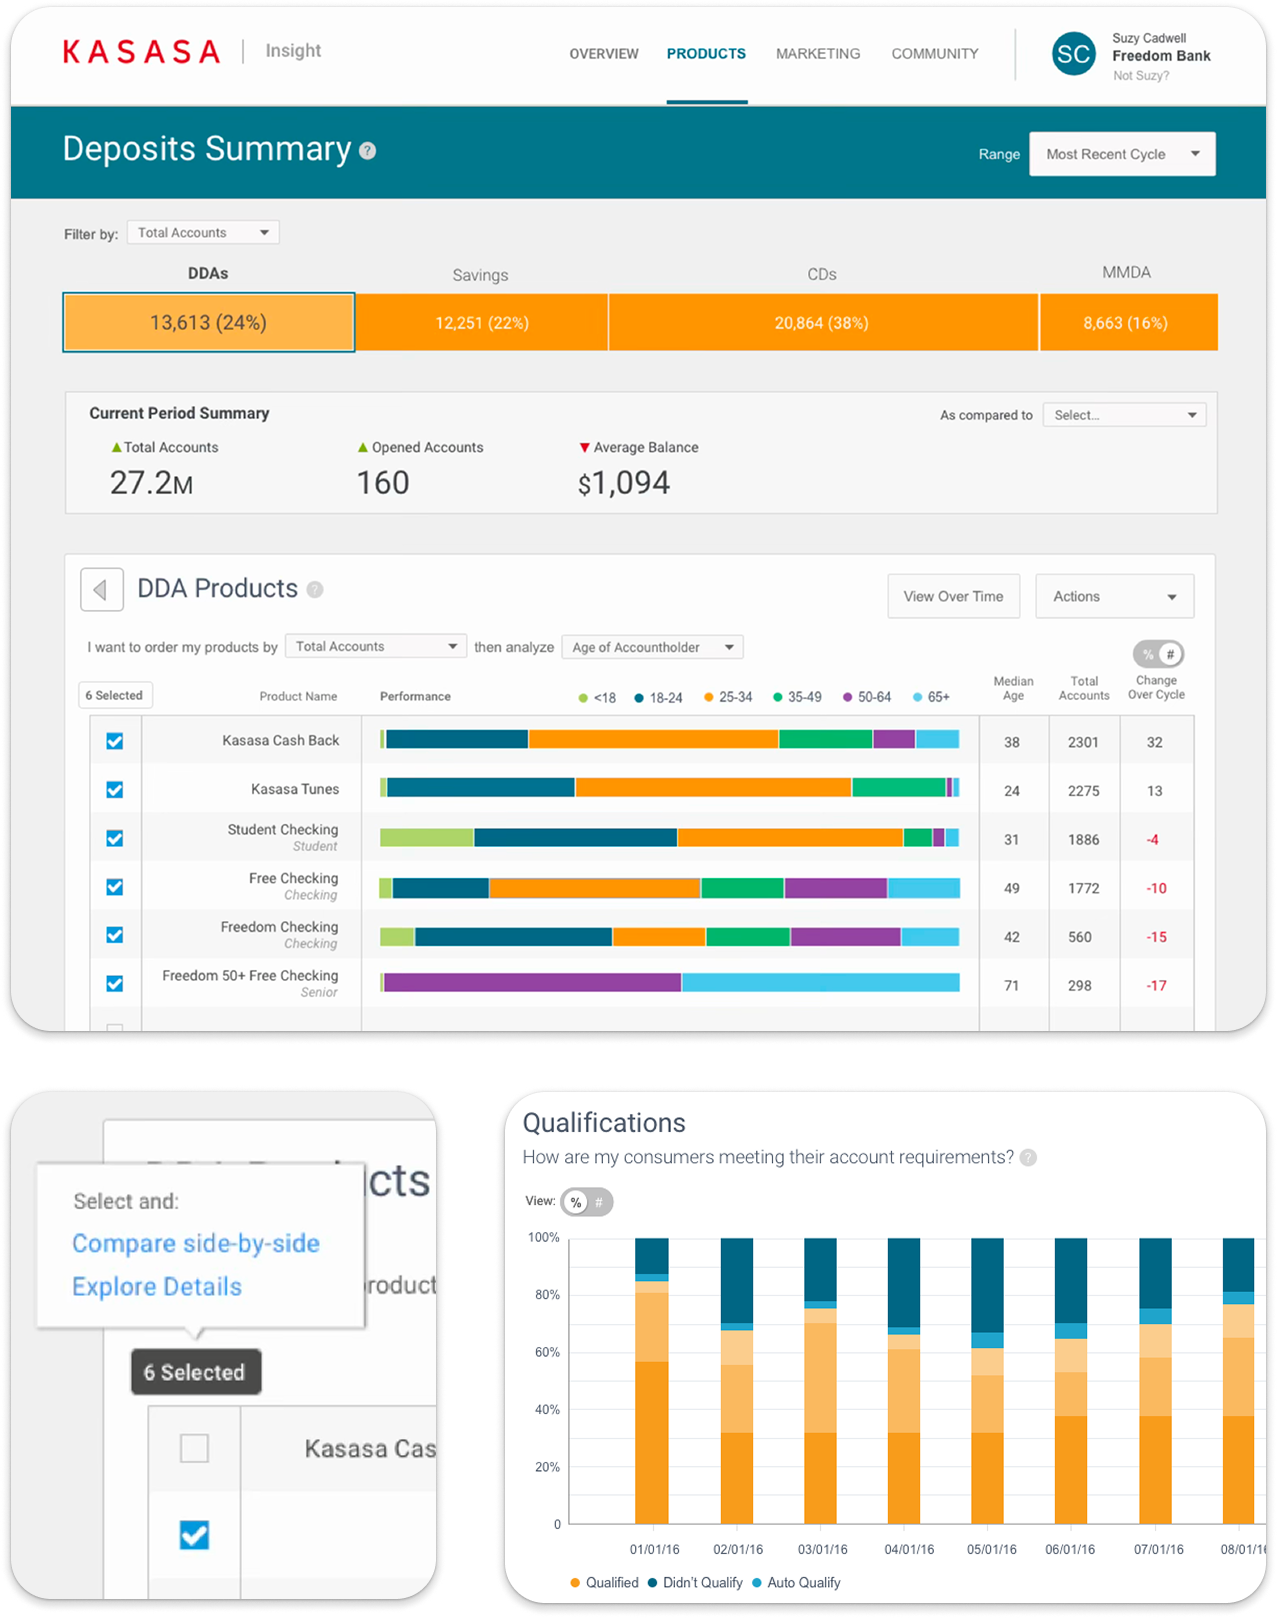
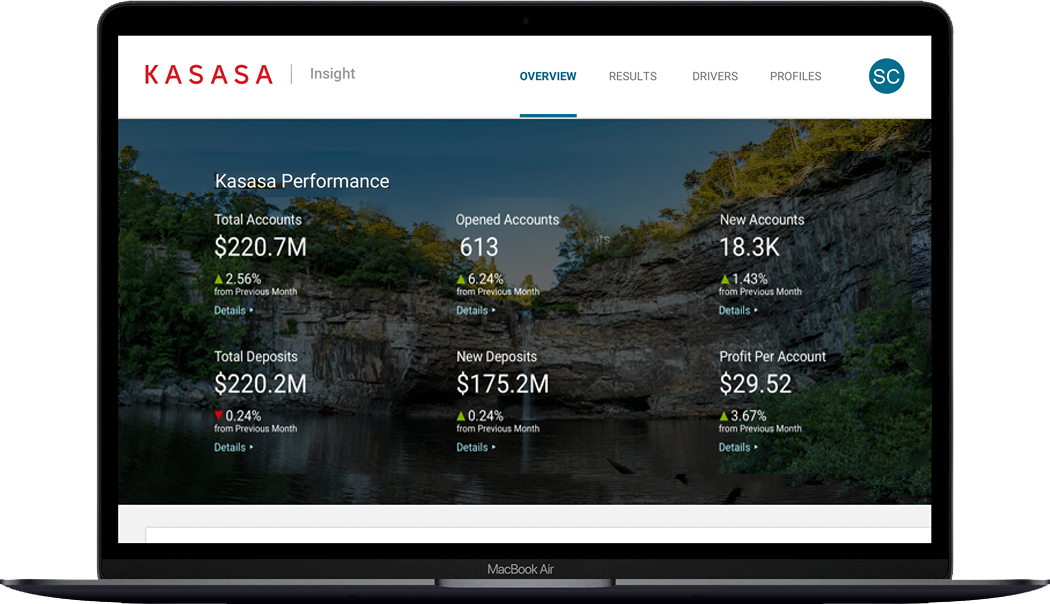
The main overview screen included the top metrics financial institutions cared most about: Total Accounts, Opened Accounts, and Total Deposits compared to the last cycle. Those were the jumping-off points into more granular discovery. Then, a toggle that showed all Kasasa Accounts compared to new Kasasa accounts with drilldowns for each. The story we heard most from financial institutions was now immediate and compelling.
Drill Deeper
Overview metrics connected seamlessly to supporting detail, helping users move from observation to understanding without losing context.
Compare with Confidence
Side-by-side views made trends easier to spot and performance easier to evaluate across products, branches, and time periods.
Plain-Language Reporting
Technical metrics were translated into everyday language, helping more people understand the story behind the numbers.
UX Maturity
Building the foundation for scale
As the product evolved, it became clear that the challenges we were solving extended beyond a single application.
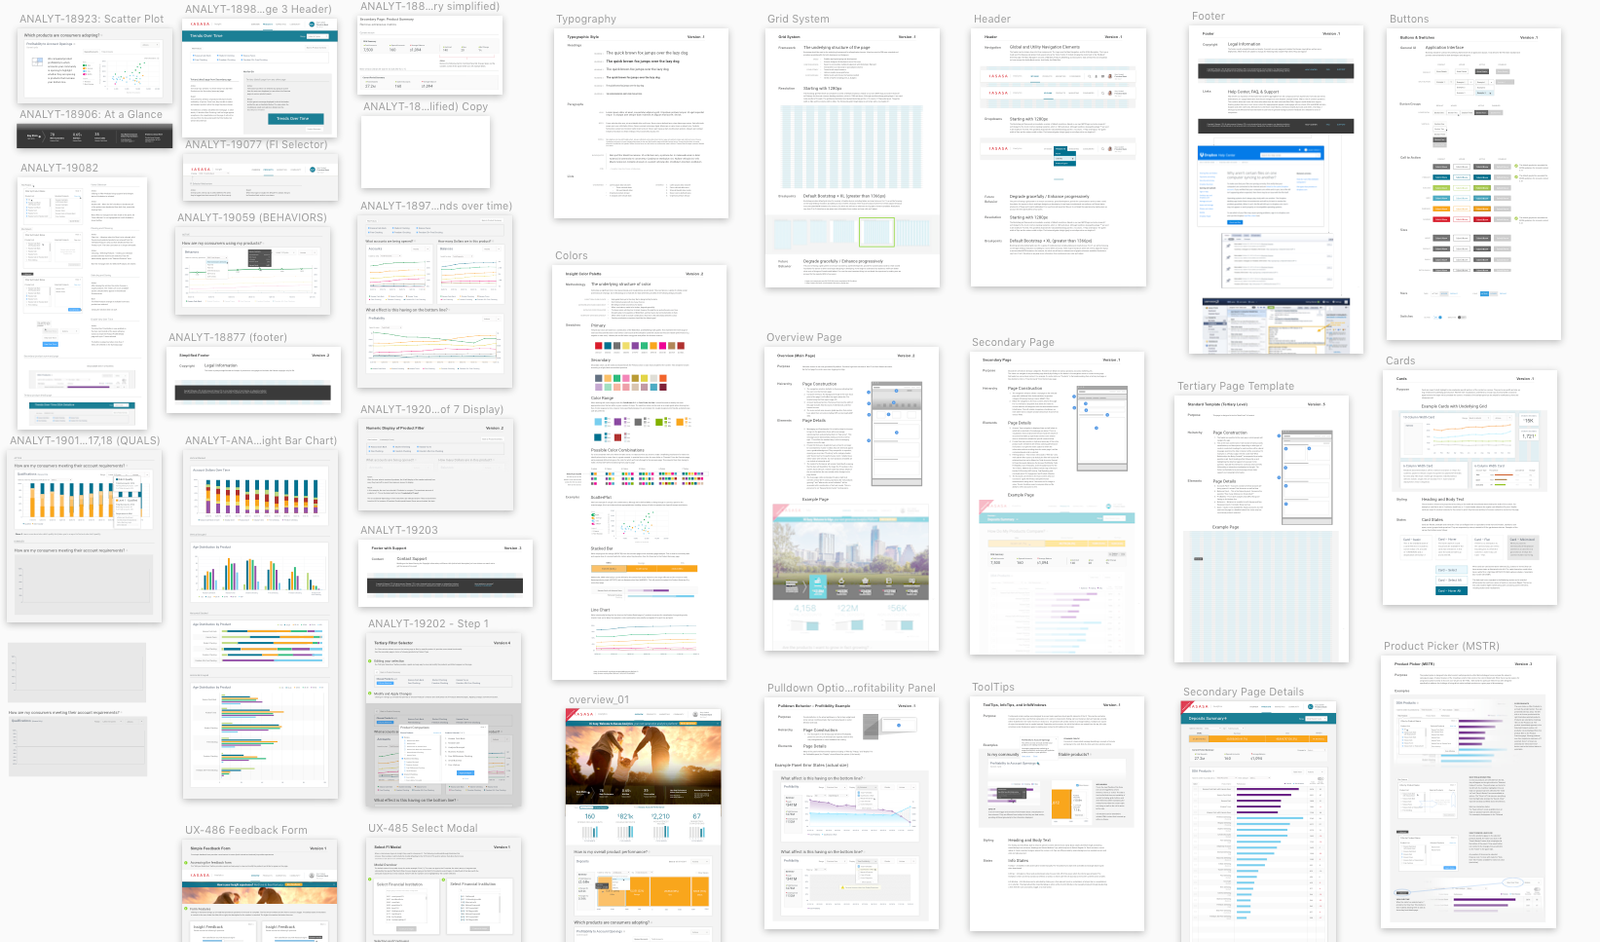
I partnered across teams to establish Kasasa’s first digital style guide, documenting typography, color, spacing, components, and data visualization patterns in a shared system.
What began as a practical solution for Insight ultimately became the foundation for broader design consistency across the company’s product portfolio.
Adoption followed understanding.
As clients became more comfortable finding answers inside the platform, behavior began to change. Instead of exporting data into spreadsheets for additional analysis, users increasingly stayed within the product to explore performance, investigate trends, and answer questions directly.
The project was later recognized as a Nielsen Norman Group case study and helped establish a stronger foundation for future product and design system investments across the organization.
- Localized Imagery & Personalization
- Desktop & Mobile Friendly
- Internal & External Adoption
- NNG and UX Mastery Recognition
- Promotion to Sr. UX Manager, Product
Reflection
Looking back, I would have formalized partnerships with Client Success and Support much earlier in the process.
Those teams spoke with customers every day and carried a wealth of contextual knowledge that wasn’t always visible through research sessions alone. Once we began working more closely together, decisions accelerated, and opportunities surfaced faster.
That lesson has stayed with me throughout my career.
The best insights don’t always come directly from users. They often emerge at the intersection of customer conversations, operational realities, business goals, and research findings. Bringing those perspectives together is where meaningful transformation happens.
Capabilities Applied
- Customer Discovery
- Research Synthesis
- Information Architecture
- Data Visualization Design
- Decision-Support Design
- Complexity Reduction
- Cross-Functional Facilitation
- Design System Foundations
- Platform Design
- Executive Communication
- Product Design Leadership
- Systems Thinking
Platform Utilization
79
%
First Month Growth
114
%
Results
When I finally left Kasasa, the product has over 3700 external sessions YTD. We went from 16% external in January 2019 across approximately 570 sessions to 30% in November 2019 across 1430 sessions. In contrast, the original application had marginal utilization (less than 2% external sessions across an even smaller cohort). Clients were deriving value resulting in longer session times and more engagement.