We increased internal involvement and rocketed utilization by over 400% in the first week

Jump to results

The Challenge

Challenge

Uncovering the truth

Uncovering the truthAs the flagship Business Intelligence platform for the company, the original Insight Exchange suffered from lack of adoption internally and externally. I was hired explicitly to remedy this. See article on UX Mastery for more >>

The existing product had been built without user input and on an old, deprecated technology stack, which made the decision to start over from scratch the right one.

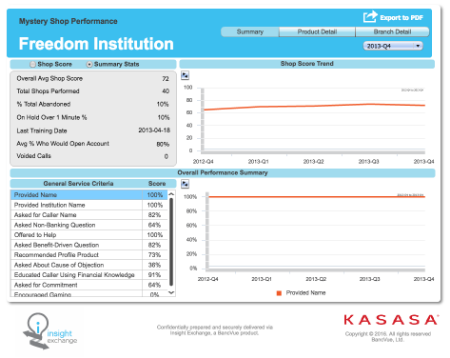
Our new effort would put the user at the center, understanding how they measure success at a high level first. We discovered that logging into a separate system wasn't the main problem (something users originally told us). It was that the tool wasn’t very useful because key performance indicators were hard to decipher and often required too many hoops to jump through in the way of unusual design patterns and visualizations. Our internal consultants weren’t even using it, preferring their own home-grown Excel solutions to this clunky, antiquated offering.

User-Centered Solution

Mapping, stories, & themes

Bringing a rigorous user testing mindset to the analytics team was a new experience for them. The notion of actually listening to users and not demoing software took discipline and persistence. I knew I needed to make this a collaborative effort to bring everyone along.

I opened up the design process to be inclusive, inviting everyone including PMs, DEVs, and Researchers into the fold. We worked together in organizing Empathy Map findings into overarching themes. The themes were rolled up into stories that informed our prioritization roadmap.

User-Centered Solution
kasana flow
kasana doc
kasana mob

Listening & Learning

We didn’t stop there. Multiple avenues for gleaning valuable user feedback were employed. We incorporated internal stakeholder interviews, client on-sites, informational client calls, SUS scoring, and Qualtrics surveys.

Data-Driven

Our data uncovered that utilization was so low because half of our clients didn’t even know the tool existed. It wasn’t being pushed by internal staff because it wasn’t perceived as reliable or easy to use. User testing revealed this to be true.

The information displayed in the old tool wasn’t relevant nor did it have the proper granularity for Financial Institutions to take action. We often heard clients say they had a hard time deciphering the meaning from the flood of data they were seeing. Consultants had a hard time explaining it too, which led to a flood of questions.

Collaborative Workshops

Winning our internal staff over meant showing them that we were committed to creating a product that worked for them. I initiated open workshops in which stakeholders would vote on featuers they felt valuable.

We did this for the Consultants, DEV teams, and Sales staff to see where we could make the most impact within the UI. We later consolidated the feedback to help inform the prototypes we would later share with both Clients and the stakeholders.

Orchestrated tabel
Measured tabel

Orchestrated & Measured

Realizing the importance of a well executed strategy, I planned out our four month release plan prior to launch. I created our initial hypotheses and tracked them through the testing and beta testing phase to ensure we’d have alignment prior to the release.

A challenge that cropped up was often people would say they’d do something, but since they weren’t seeing real data yet, we didn’t really know. That was a risk we were willing to take based on the current utilization of the old tool. The thinking was that any improvement would be better than the previous iteration.

We used a modified version of Google’s HEART methodology, which captured user sentiment in three categories we could track. More info on how we measured the new Insight Platform here >>

Standards

Building beautiful, scalable interfaces with precision

While I had sole resposibility of the design asthetic of Insight, I wanted to introduce the same disipline I had intoduced on some of my previous work to ensure the product would exist long after I stopped working on it.

I created a design system that encapsulated the new look and feel and distributed it via InVision. Developers could look up colors, styles, and dimentions while future designers could add to the elements and expand them as things grew.

Big Reveal

I presented the final product at our Symposium of Peers, a company retreat attended by 400+ employees and vendors. I walked through the product and highlighted the effort that went into the redesign, focusing on the user.

To show real-word performance, I created a quick video that demonstrated some of Insight’s functionality, focusing on new speed & efficiency gains. I shared real data, de-identified for demo purposes. The responsive design meets clients where they are which is important because clients told us they conduct at least some of their business remotely.

The feedback was positive, creating buzz on various channels, just as we had hoped.

Big Reveal

“I loved the Insight demo … Great job creating those last minute widget changes. The video example was perfect.”

Iterating Through Change

The demo was just the start. By the end of the year our team structure was changing, and so was our Insight product.

The company was going through a re-organization, which had the BI and Research teams moving under Technology. I would now be heading up Product UX as the Senior UX Manager responsible for not one but over a dozen products.

The transition meant I had to forgo some of the long-term plans for the sake of meeting immediate market demands. We streamlined our offering to include only

the KPIs our clients and stakeholders could reliably support. This meant that while some of the functionality was eliminated, we had a better, more succinct story to tell with the data.

Insight has gone on to be a flagship tool that tells a more complete story of how our banking products improve the bottom line for financial institutions. The foundation I created will continue to evolve and grow.

Iterating Through Change

Results

Continually listening and iterating on ideas proved to be a winning mix for the team and I. In a recent review of our utilization, institutions leveraging our legacy platforms are switching to the new version to take advantage of the advanced features they don't have in the old tool.

Today, the product has over 3700 external sessions YTD. We went from 16% external in January 2019 across approximately 570 sessions to 30% in November 2019 across 1430 sessions. In contrast, the original application had marginal utilization (less than 2% external sessions across an even smaller cohort). Clients are deriving value resulting in longer session times and more engagement.

114% Lift

Within the first month of our Analytics redesign and steady increases over subsequent months.

114% Lift


The success has yielded company savings across the board. In addition, clients are becoming more comfortable with the data.